Tool · Desktop · Windows + macOS
Aptamer Analysis Tool
A desktop application for aptamer sequencing data analysis — sequence trimming, pattern recognition, clustering, and structured reports from FASTQ data, tuned for routine lab use and long-running batches.
Free for academic use · On Windows the Launcher installs and updates this tool for you; the macOS build is still a direct download while the macOS Launcher is in progress.
/ Introduction
What it does.
Aptamer Analysis Tool reads .fastq, .fq, .fastq.gz, and .fq.gz files, performs sequence trimming, prepares a clustering matrix, applies EPS-based clustering, and writes structured PDF / PNG / XLSX / Word reports. Compared with the original Python workflow, this build was rebuilt for interactive performance, lower memory usage, flexible trim configuration, batch processing, and more informative output — better suited for routine lab analysis and long-running sequencing batches.
-
Fast EPS recalculation
After matrix preparation, changing the EPS clustering radius takes seconds instead of the ~10 minutes a full pipeline rerun used to need — making parameter sweeps practical.
-
Memory & thread optimization
Sequence loading, distance calculation, and background scheduling were rebuilt to lower peak memory and stabilize multi-thread runs, so the tool fits more ordinary lab computers.
-
Tiered trim modes
Simple,Pro, andUltra— from strict standardized trim to fully custom forward/reverse primer regions with adjustable mutation tolerance. -
Multi-file batch processing
Queue multiple FASTQ files with shared parameters and let the tool run unattended. Failed files are recorded but do not stop the batch.
-
Real sequence-context reporting
PDF / PNG output replaces the old fixed placeholder (e.g.
GACGAC---GTCGTC) with the real six bases observed upstream and downstream of the target region, making boundaries easier to validate. -
Local-first, no telemetry
Normal operation makes zero network calls. Inputs, outputs, and logs all live on your machine; nothing is uploaded.
/ Usage
How to use it.
The most common workflow is Single File Mode — interactive analysis for one sequencing file, ideal for tuning trim parameters and exploring EPS values. The other three modes (Batch, Manual, Motif Search) share the same input/output shape and are summarized at the end of this section.
-
01
Launch & pick a workflow
Open Aptamer Analysis Tool from the Start menu or desktop shortcut. After the splash screen, the main menu offers four workflows:
Single File Mode,Batch / Multi-File Mode,Manual / Paste Sequences, andMotif Search. PickSingle File Mode.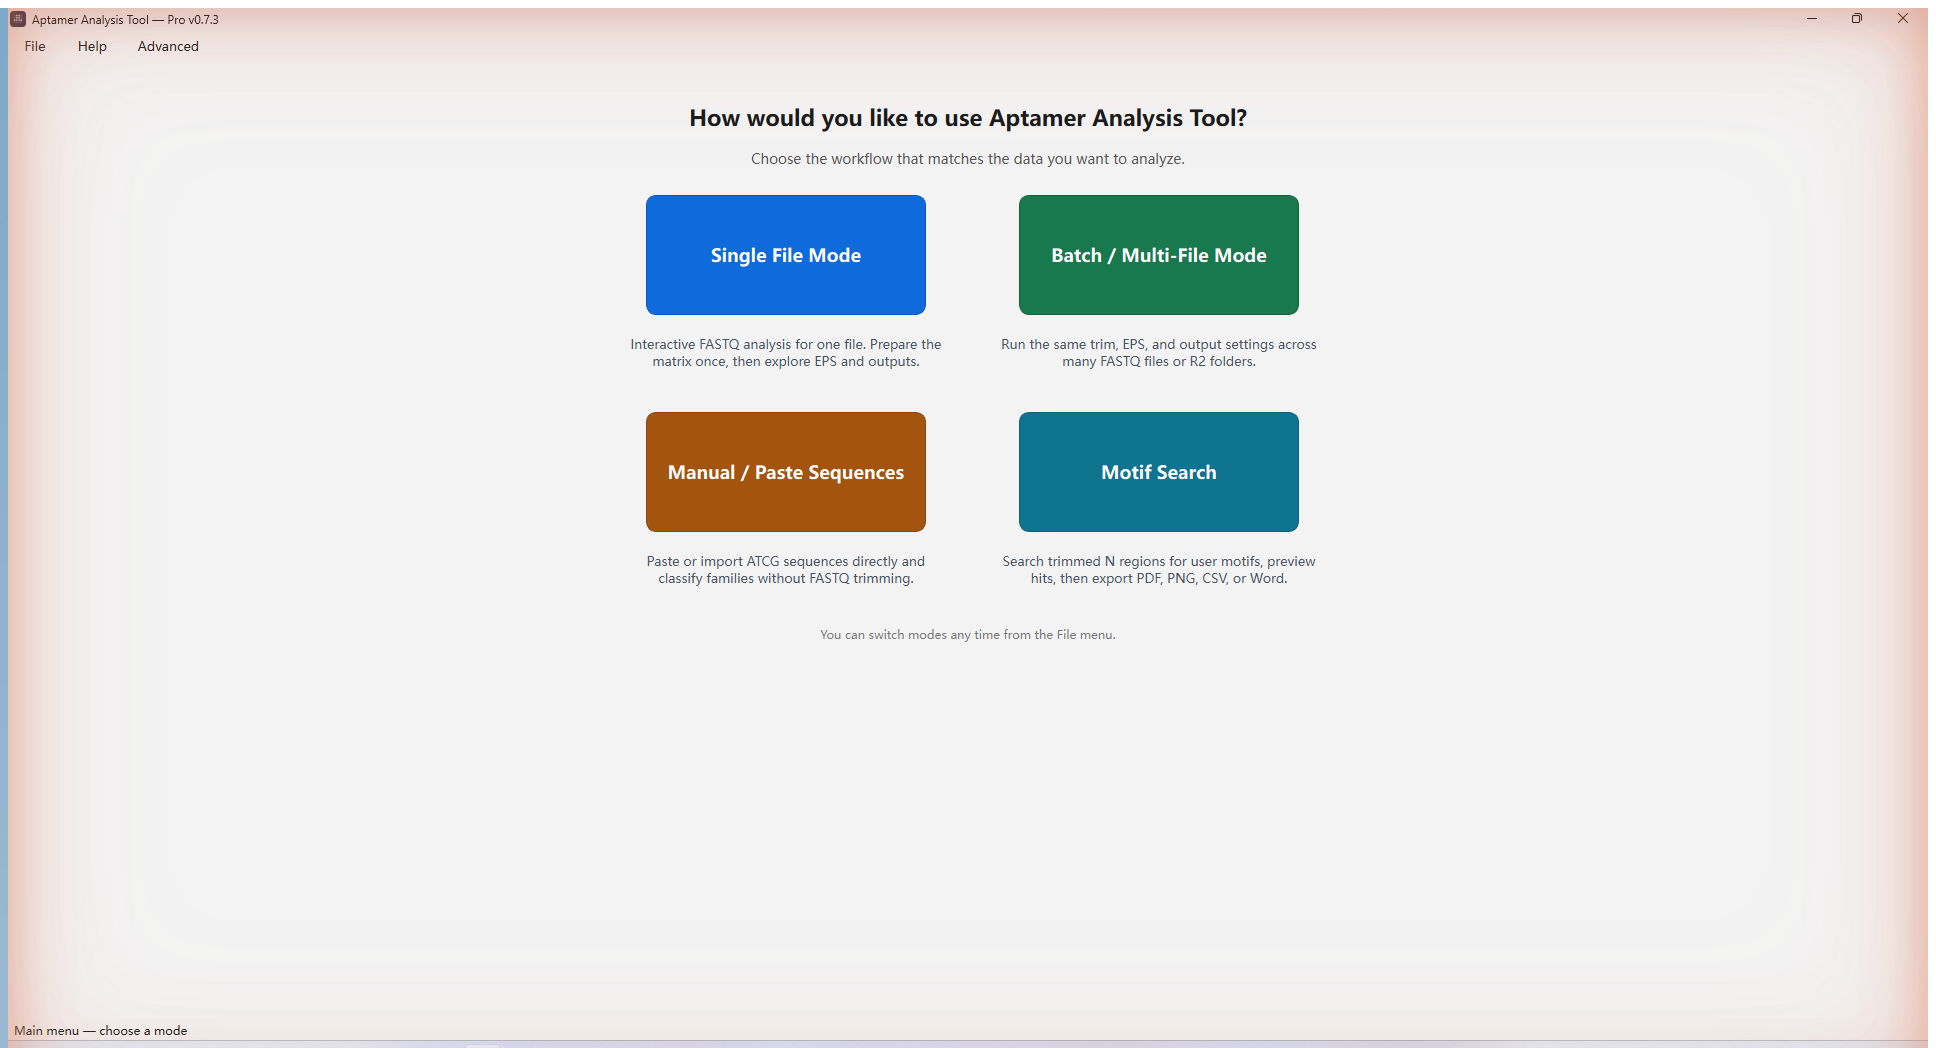
Fig. 01 — Main menu -
02
Choose a sequencing file
Click
Choose Fileand pick a.fastq/.fq/.fastq.gz/.fq.gzfile. The tool decompresses.gzautomatically and previews the first 5 FASTQ records along with file name and size. ClickNextto continue.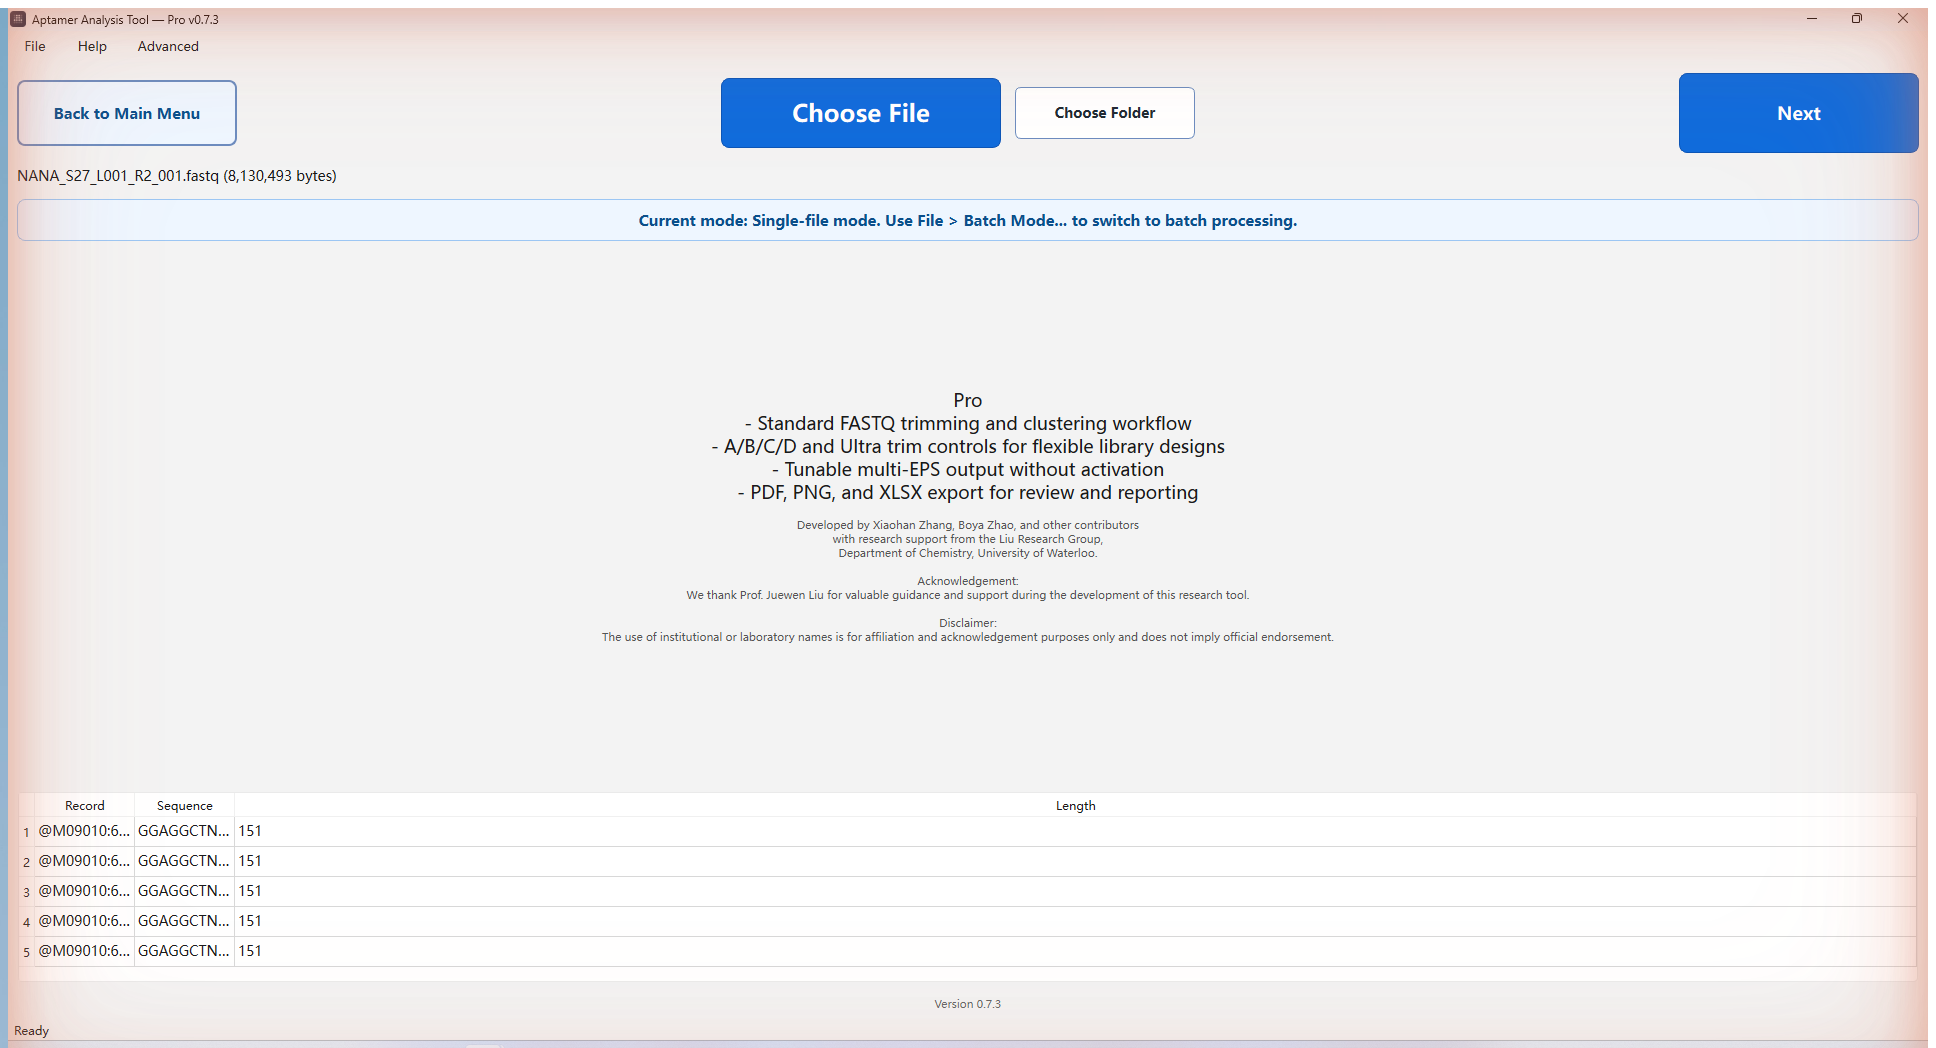
Fig. 02 — Choose file & preview -
03
Set trim parameters
Pick a trim mode.
Simpleuses fixed flanksGGGACGAC+GTCGTCCCGwith strict matching.Pro(A/B/C/D) lets you set Minimum and Maximum target-region lengths and adjust front/rear mutation tolerances (typical defaults: C=0, D=3).Ultraaccepts fully custom forward and reverse primer-binding regions for non-standard libraries.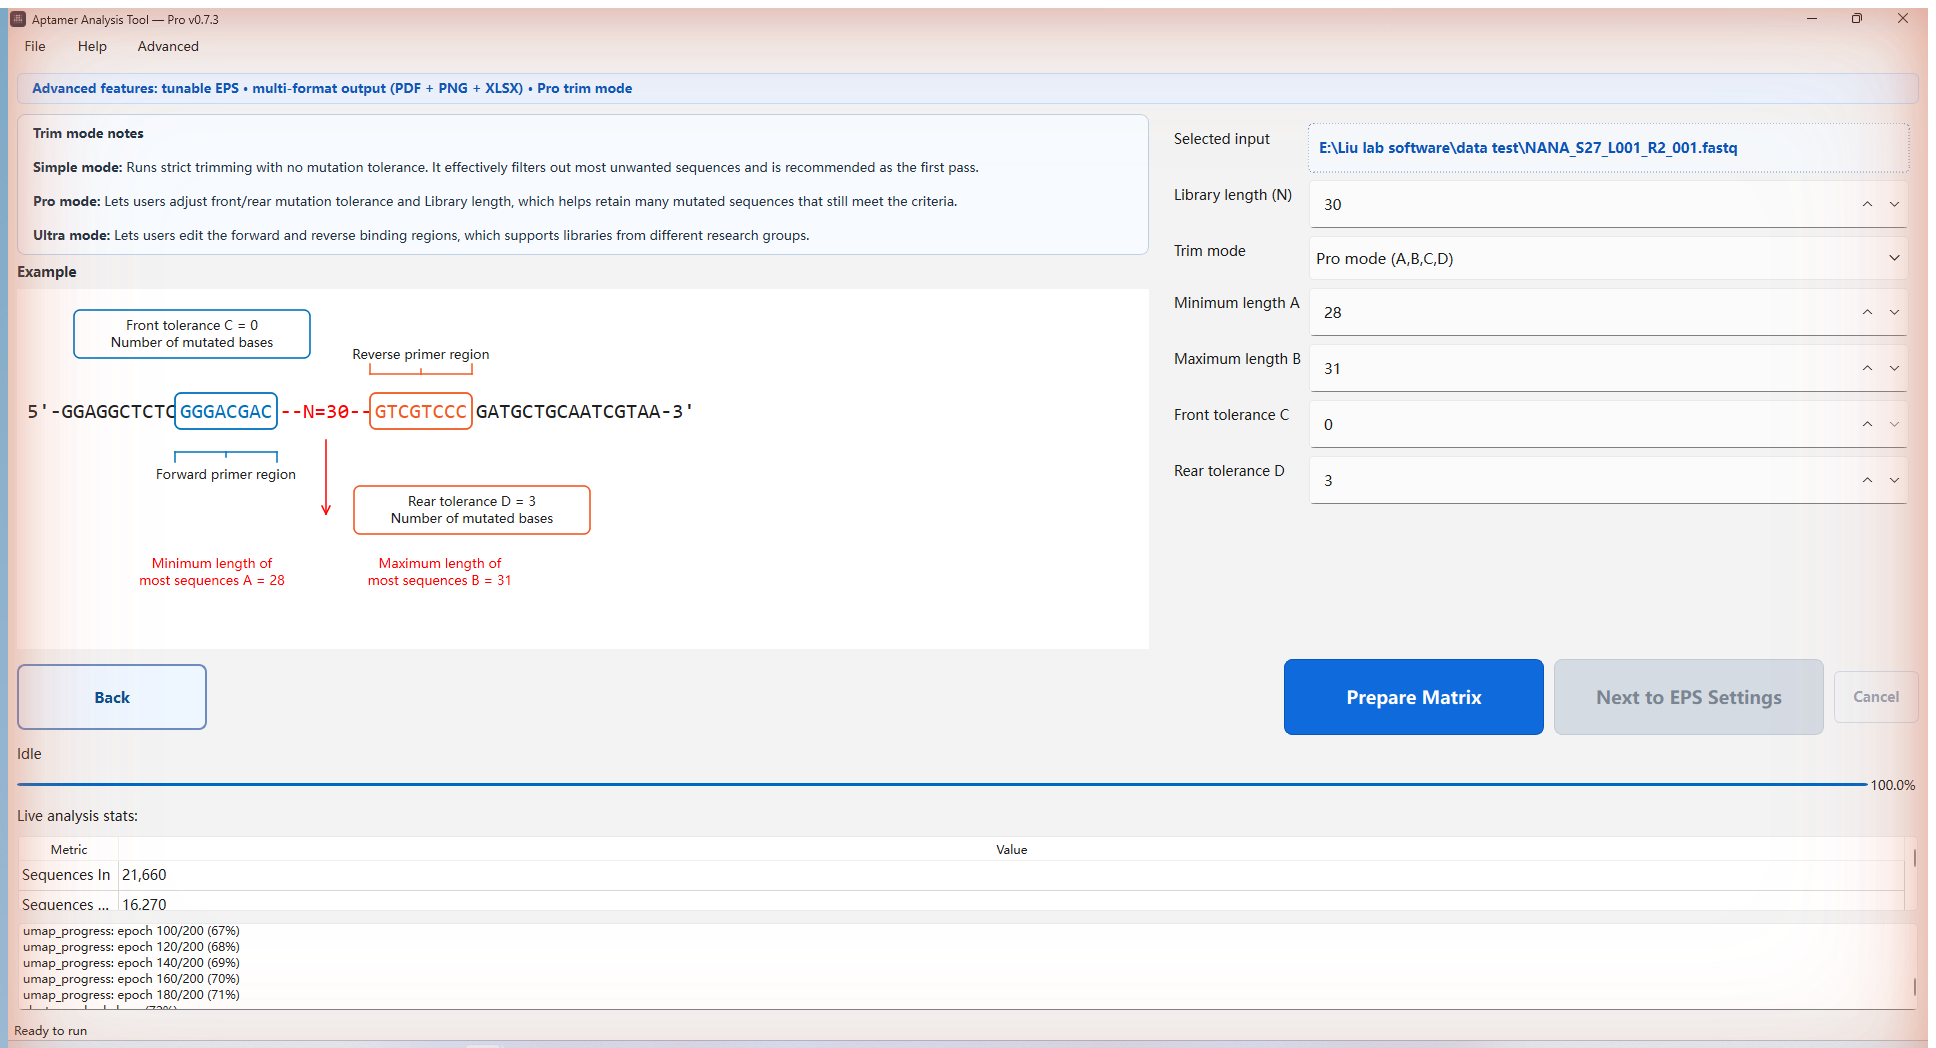
Fig. 03 — Trim parameters -
04
Prepare matrix
Click
Prepare Matrix. This is the slow part: reading the file, trimming reads, computing the distance matrix, and building clustering coordinates. Large files take longer. You canCancelat any time; wait for the interface to return to Ready before starting again.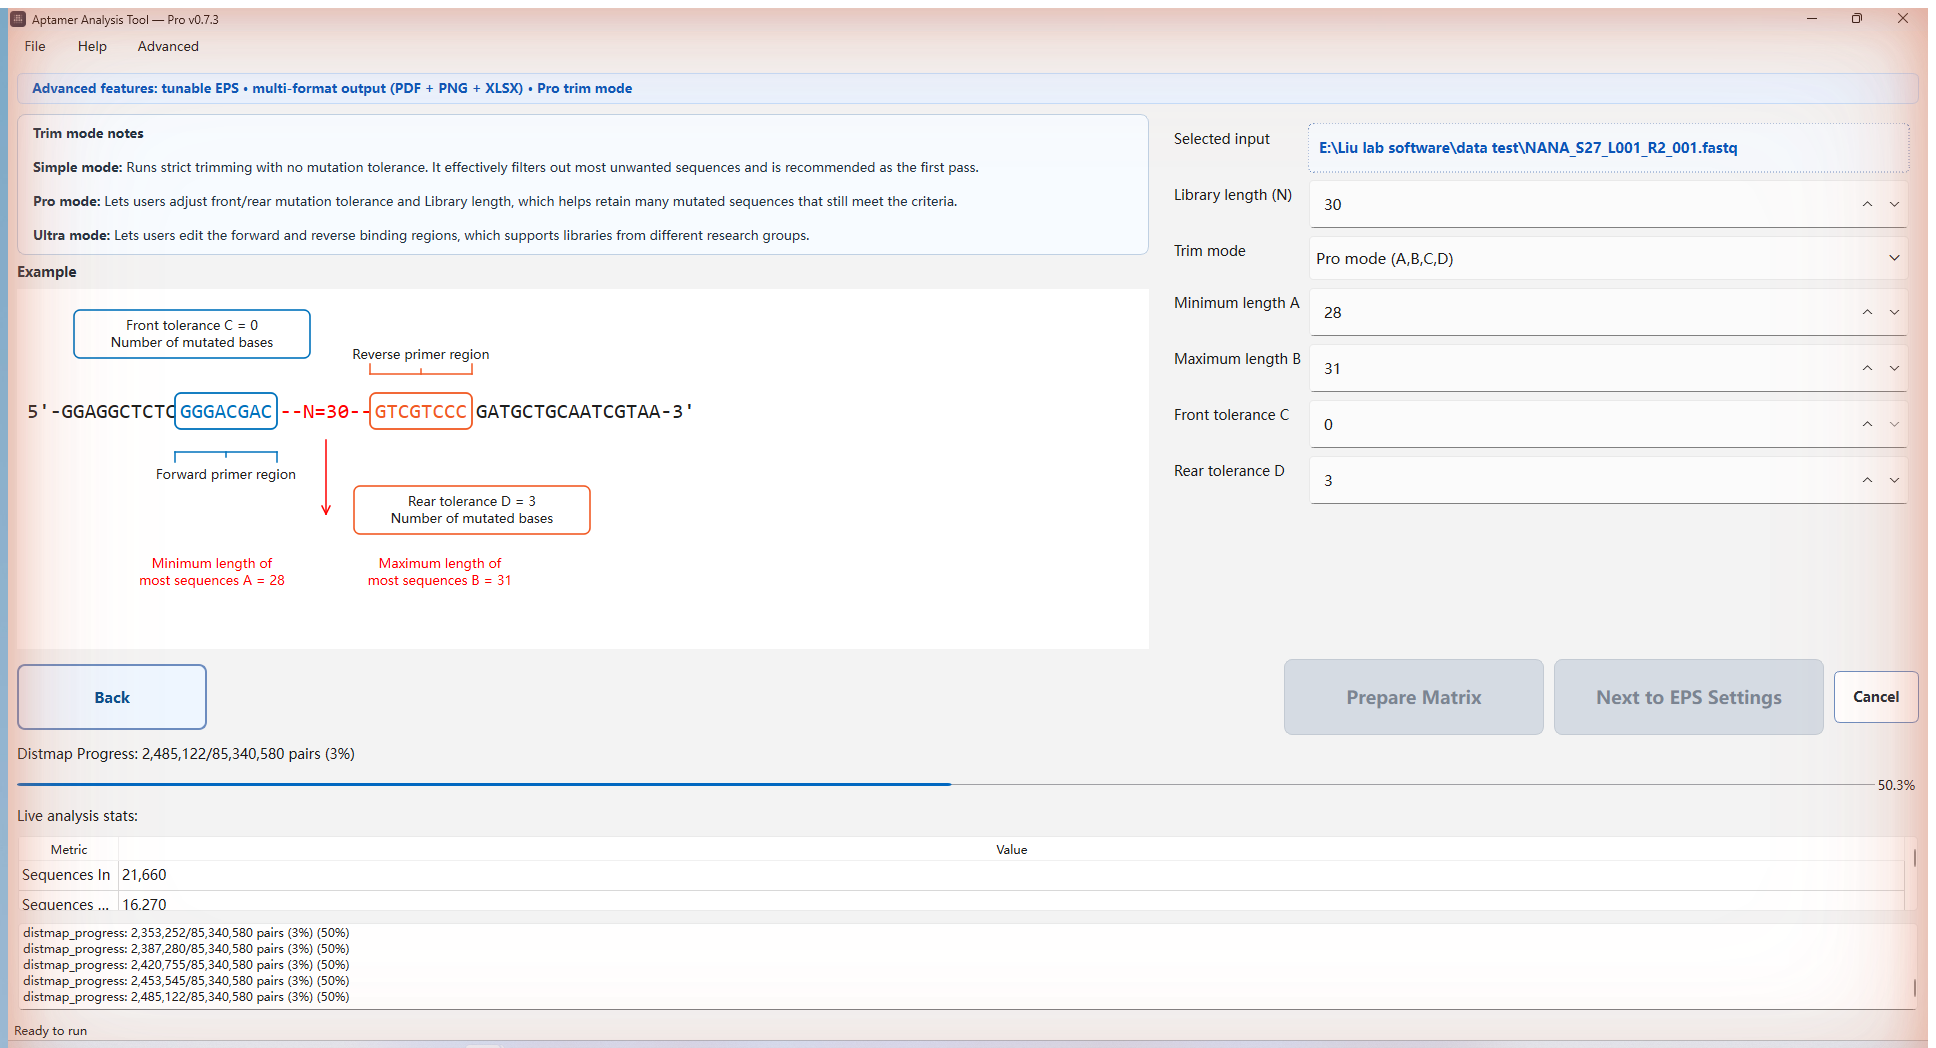
Fig. 04 — Prepare matrix -
05
Set EPS & generate output
On the output page, enter one or more EPS values (e.g.
0.80, 1.25, 1.50; supported range0.20–2.20), choose the output folder, and pick formats: PDF / PNG / XLSX / Word. Lower EPS is stricter and emphasizes conserved bases; higher EPS is more permissive. ClickGenerate Output.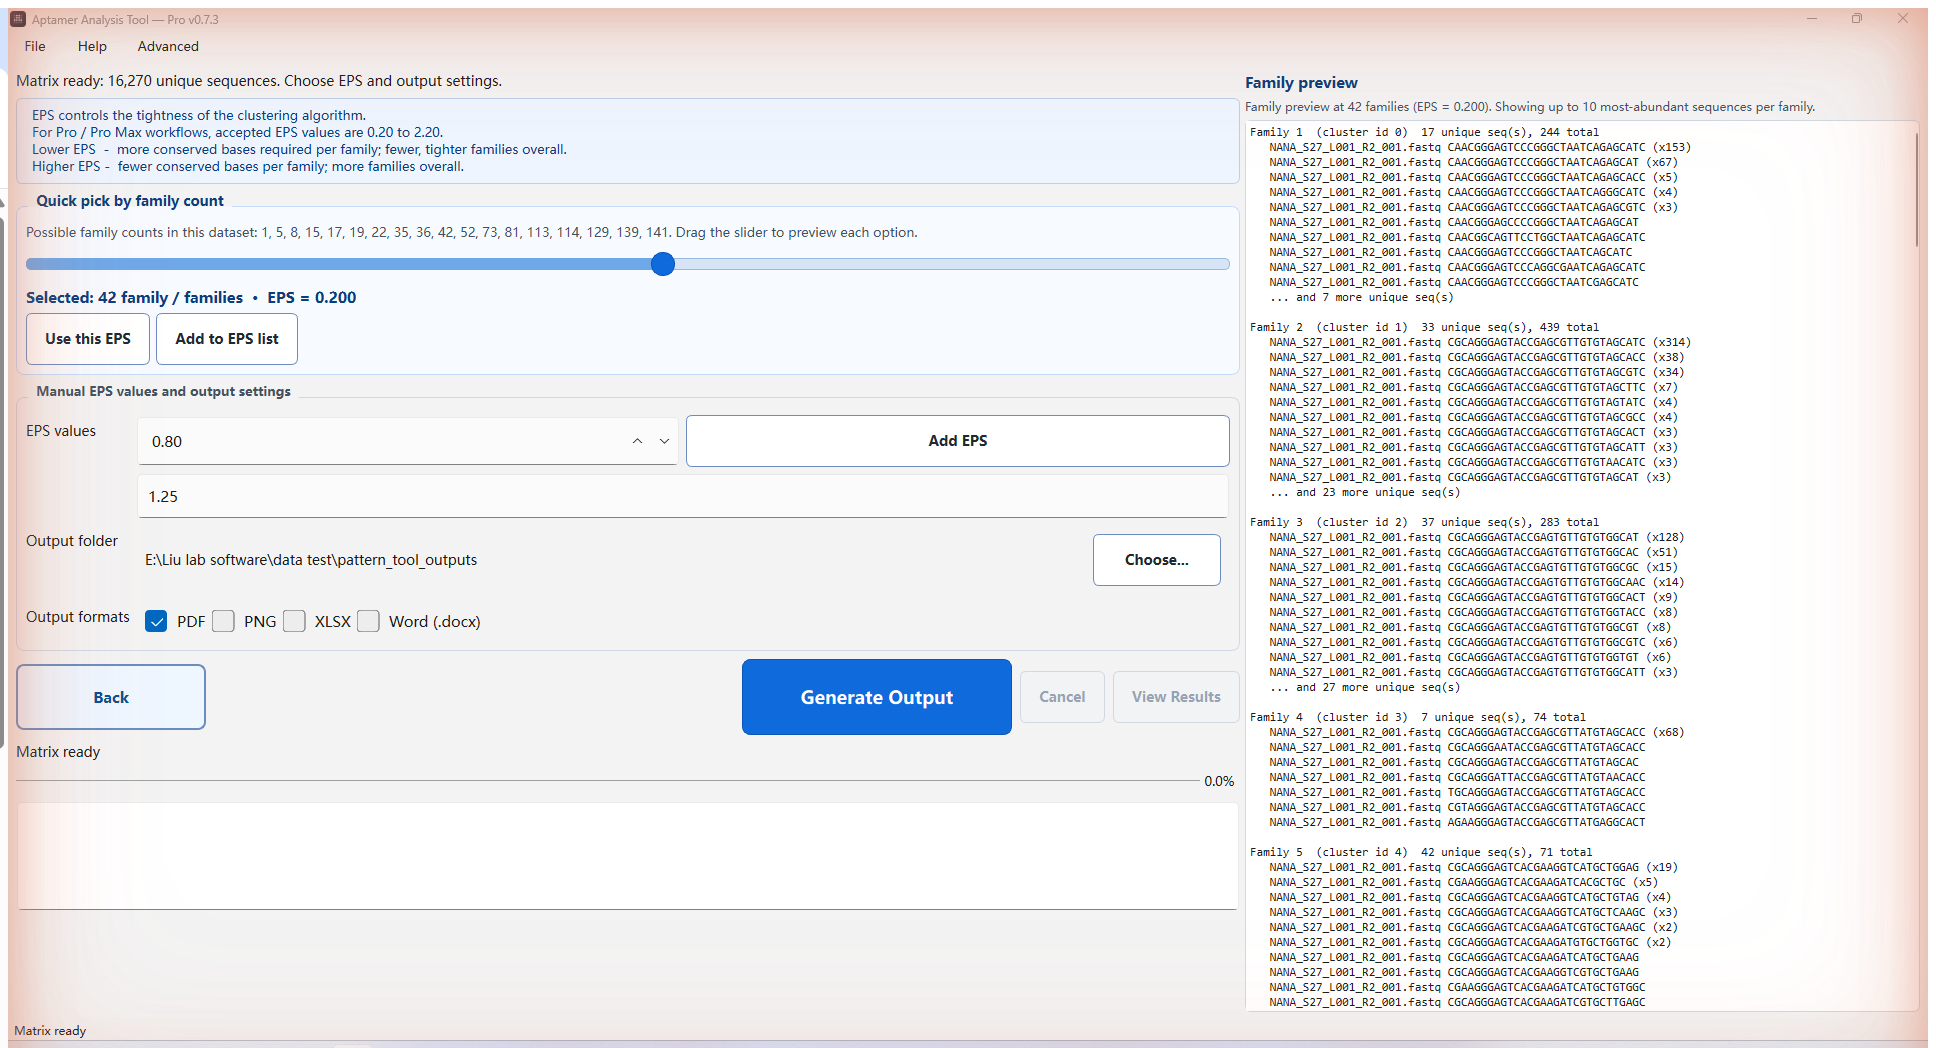
Fig. 05 — EPS & output formats -
06
Review & re-run with new EPS
On the result page, click
Open Folderto inspect outputs (named likesample-EPS08.pdf,sample-EPS125.xlsx) orExportto save a run summary. Since the matrix is already prepared, you can return to the output page and re-runGenerate Outputwith different EPS values in seconds.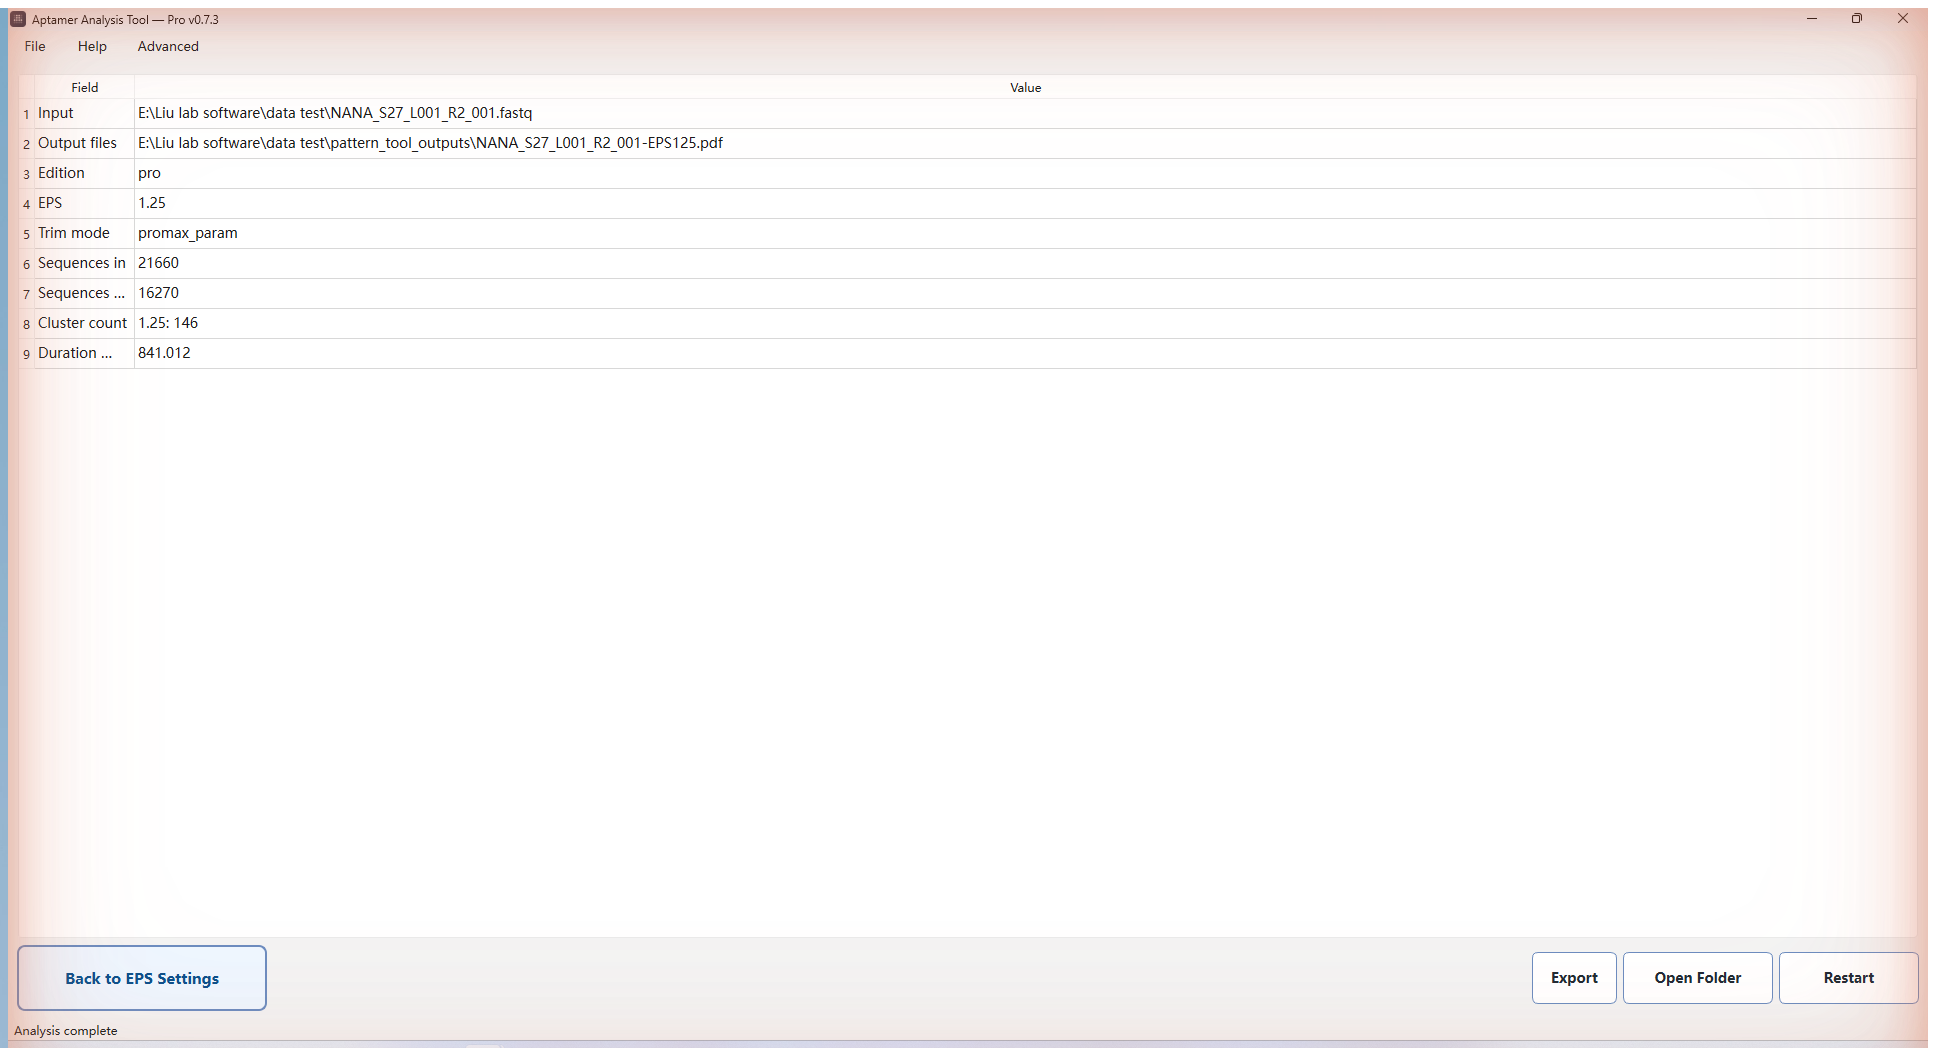
Fig. 06 — Result page
Other workflows in the same app.
-
Batch / Multi-File
Queue many FASTQ files with shared parameters; unattended runs with per-file logs.
-
Manual / Paste Sequences
Paste or import ATCG sequences (txt / docx / xlsx / FASTA) and run family classification without trimming.
-
Motif Search
Find trimmed N-region sequences containing one or more motifs (≥4 bp) with AND / OR / AND-NOT rules.
/ Disclaimer
Things to know.
-
Normal operation is fully offline.
Aptamer Analysis Tool makes no network calls during normal operation: no telemetry, no automatic update check, no automatic upload. Input file content, file names, output content, and logs never leave your machine.
-
Pro Max activation sends only the minimum.
The Pro Max build contacts the activation service only when the user requests an activation code by email. The request includes first/last name, the education email entered, application name and version, and a salted hash of the local machine code. Raw hardware serial numbers, file names, file content, logs, and analysis results are not transmitted.
The code email can take 2–3 minutes to arrive. If it doesn't show up, it's most likely in your spam / junk folder.
-
Logs and crash reports stay local.
Logs live at
%LOCALAPPDATA%\AptamerAnalysisTool\logson Windows and~/.pattern_tool/logson macOS / Linux. Crash files are saved alongside them. They are never sent automatically — sharing one always requires an explicit action by you. -
Free for academic / non-commercial use.
Aptamer Analysis Tool is free for academic research and teaching. For commercial integration or redistribution, contact the author in advance.
-
Provided as-is, without warranty.
Output is best-effort. The author is not responsible for downstream experimental decisions made on the basis of this tool's results. Validate critical findings with independent methods, and report bugs to [email protected].
-
Cite if used in publications.
If this tool contributed to a published study, please cite: Zhang X. Aptamer Analysis Tool, v0.8, Liu Lab, University of Waterloo, 2026. aptapilot.com/tools/aptamer-analysis.
/ Acknowledgments
Built with the lab.
Developed in the Bionanotechnology & Interfaces Laboratory, Department of Chemistry, University of Waterloo. The tool's features were shaped by the lab's ongoing SELEX and aptamer-engineering projects, and by the testing and feedback of every group member listed below.
-

Prof. Juewen Liu
Advisor
Professor of Chemistry at the University of Waterloo, College member of the Royal Society of Canada (RSC), and Tier 1 Canada Research Chair in Biosensors & Bionanotechnology. Group lead for the aptamer / DNAzyme / nanomaterial research that motivates this tool.
-

Boya Zhao
Initial Python prototype
Undergraduate at Tsinghua University (Prof. Sichun Zhang's group). Wrote the initial Python script during a research visit to Liu Lab in July 2025 — the prototype that became the algorithmic foundation of the current desktop tool.
-

Xiaohan Zhang
Author · Postdoctoral Researcher
Postdoctoral researcher at the University of Waterloo under Prof. Juewen Liu. PhD in Inorganic Chemistry, Shandong University (2024). Designed, implemented, and maintains the Windows build.
-

Yuanli Li
macOS port · Beta testing & feedback
Third-year undergraduate in the Materials Nanoscience joint program (Beijing Jiaotong University × University of Waterloo). Responsible for the macOS adaptation and release, plus extensive beta testing and bug reporting throughout the 0.7.x cycle.
Special thanks to the beta testers who tried early builds, broke things, and reported back: Wenhua Shang, Jiayi Liang, Bing Jin, Yachen Xie.
Open-source libraries. Aptamer Analysis Tool stands on the work of these projects — sincere thanks to their maintainers:
- PySide6
- HDBSCAN
- scikit-learn
- UMAP-learn
- ViennaRNA
- matplotlib
- NumPy
- regex
- requests
- tqdm
- cryptography
/ FAQ
Questions people actually ask.
-
What input files does it accept?
It reads .fastq, .fq, .fastq.gz and .fq.gz directly — no need to decompress large sequencing archives before analysis.
-
What does the analysis pipeline actually do?
Sequence trimming, then preparation of a clustering matrix, then EPS-based clustering, then generation of structured reports. Trim configuration is adjustable rather than fixed, so the same build handles libraries with different primer and scaffold layouts.
-
What formats are the reports in?
PDF, PNG, XLSX and Word — chosen so results can go straight into a lab notebook, a slide deck, or a manuscript supplement without reformatting.
-
Can it handle large batches and long-running jobs?
Yes — this build was rebuilt over the original Python workflow specifically for interactive performance, lower memory usage and batch processing, with long sequencing batches as the target case.
-
Which platforms, and what does it cost?
Windows through the AptaPilot Launcher, which installs and updates it for you; macOS as a direct .dmg download while the macOS Launcher is still in progress. Free for academic use.
/ Citation
How to cite.
If this tool contributed to work you are publishing, a citation is the most useful thing you can send back — it is what keeps the tool maintained and lets other people find it.
APA
Zhang, X. (2026). Aptamer Analysis Tool (Version 0.8) [Computer software]. https://aptapilot.com/tools/aptamer-analysis/
BibTeX
@software{zhang_aptamer_analysis_2026,
  author  = {Zhang, Xiaohan},
  title   = {Aptamer Analysis Tool},
  year    = {2026},
  version = {0.8},
  url     = {https://aptapilot.com/tools/aptamer-analysis/}
}
/ Also in the toolkit
Other tools.
 Web · Online
Kd Fitting Tool
Uses the full binding equation to fit true Kd curves. Data stays in your browser.
 Desktop · Windows · Single-file
AptaFold
DNA aptamer folding with Na⁺ / Mg²⁺ / K⁺ / Ca²⁺ / temperature inputs and G-quadruplex detection. Reads this tool's output directly as a batch source.
 Desktop · Windows · Experimental
Structural Family Classification
Group SELEX aptamers by loop-region structure with a self-written motif-block classifier. Ingests this tool's trimmed output.